Stackdriver Debugger: add application logs on the fly with no restarts
Sharat Shroff
Product Manager
Here on the Google Stackdriver team, we aim to eliminate repetitive and tedious work, so that you can focus all your time on your task at hand. The latest example is adding ad hoc logs to your application while it's still running, using "logpoints" — an important and critical tool when debugging an application.
Today, adding logs as part of the debugging process goes like this:
You've reviewed the errors and logs, looked at the traces and have compared it all with your code. You have a hypothesis about where the problem's occurring, so you open up your source code, and add new log statements to validate it. You then build, test and re-deploy the code. You repeat this process until you've found the root cause of the error.
With the latest release of Stackdriver Debugger, we've simplified this entire workflow into these simple steps:
Step 1: From a command shell, add a logpoint to your running application using the gcloud beta debug logpoints create command.
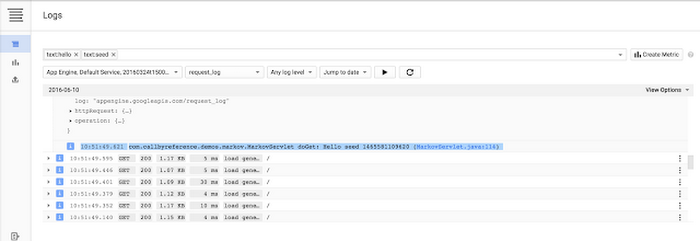
Step 2: View the logs page.
That’s it! No need to restart or redeploy.
The debug logpoints command allows you to create, list and delete logpoints. For example, you can create a logpoint as follows:
$ gcloud beta debug logpoints create MarkovServlet.java:114 "Hello seed {seed}"
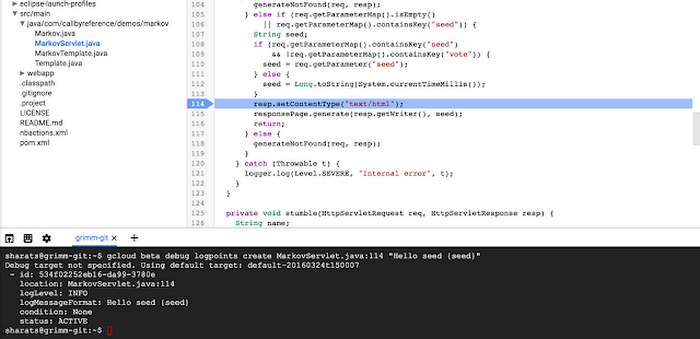
Stackdriver Debugger will apply the logpoint to all running instances and output the log message the next time that code path is executed.
Logpoints automatically expire after 24 hours or unless they're manually deleted. The performance overhead for a logpoint is the same as a coded-in log statement. The debug command is also agnostic to the number of running instances of your application.
Logpoints are available for Java, Python and Node.js applications running with Stackdriver Debugger enabled.
In addition to creating logpoints, you can use gcloud beta debug command to create, list and delete snapshots, providing you with the stack trace and variables of your running application. For a list of all the supported debug commands, please refer to the Cloud SDK Documentation.
Give it a whirl and let us know if you like it. To learn more about Stackdriver Debugger, please visit the Debugger page.