Six things Stackdriver brings to the DevOps table
Aja Hammerly
Developer Advocate, Google
Accelerate State of DevOps Report
Get a comprehensive view of the DevOps industry, providing actionable guidance for organizations of all sizes.
DownloadAs someone for whom DevOps and sysadmin tasks are only part of my job, having all the tools I commonly need in one place is a huge advantage. Stackdriver gives me exactly that. Monitoring, logging, debugging and error reporting are all integrated and provide the essential tools I need to keep my websites up and healthy. I also like that Stackdriver doesn’t require me to have deep system administration knowledge to set up basic monitoring. With minimal effort, I’m confident that I'll be notified if my application has an issue.
I gave a talk at Google I/O 2016 titled "Just Enough Stackdriver to Sleep At Night" that gives an overview of what I like about Stackdriver. You can watch the whole thing, but this post covers some of the highlights.
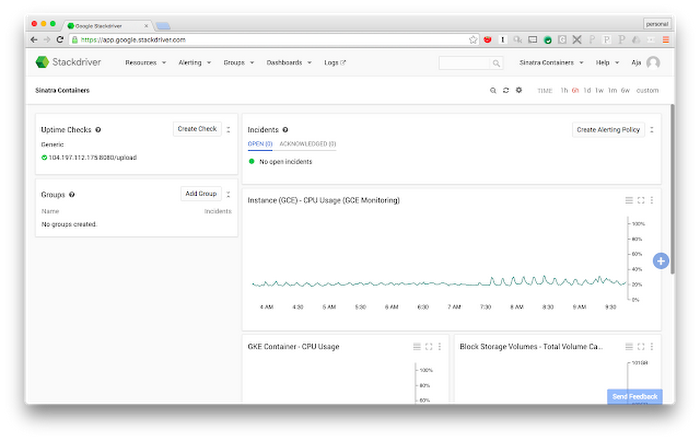
Monitoring and uptime monitoring
Setting up basic monitoring is one of the most common DevOps tasks. Stackdriver offers uptime monitoring for URLs, App Engine applications and modules, load balancers or specific instances. Uptime checks can run over HTTP, HTTPS, UDP or TCP and you can customize how often the check runs. Most of the time, I use a URL check against the root of my application or another vital endpoint, and once you've set up the check you can configure how you want to be notified. In addition to common notification methods like email and SMS, Stackdriver supports notification via messaging platforms like Hipchat, Slack, and Campfire, as well as PagerDuty and the Google Cloud Console mobile app. And if none of these options works for your team, there's a configurable webhook.Application-level monitoring
Another thing DevOps teams want is application-level monitoring. Stackdriver can monitor many common tools/frameworks including nginx, Apache, Memecached, MongoDB, MySQL, PostgreSQL and RabbitMQ. To begin monitoring these applications, all you need to do is add a config file to your system and restart the monitoring agent. Of course Stackdriver supports custom monitoring if your particular stack isn't already supported.If your application's running on Google Cloud Platform, Stackdriver automatically looks at open ports, running services and instance names to determine if you're running any common tools, and if so, it makes metrics for those tools available for monitoring. For example, if you're running a MySQL server on Google Compute Engine with an instance called "MySQL" and the mysql process is running, Stackdriver will detect that and add the MySQL metrics to the monitoring options.
And if you're using Google App Engine, Stackdriver supports request-level latency monitoring. You can look at latency for a particular class of responses, say 5xx errors or 2xx successful responses. You can also look at the overall average or the 95% or 5% case. This is particularly helpful when your request latency occasionally has outliers.
System-level monitoring
Stackdriver also supports system-level monitoring. You can monitor disk usage and I/O, memory usage and swap, CPU usage and steal, processes (running, sleeping, zombies), network traffic and open TCP connections. System-level monitoring can alert you if disks are filling up too quickly or if the CPU is spiking outside of the acceptable range.Monitoring some parts of the system requires installing the Stackdriver monitoring agent on the machine. Installing the agent only takes a few minutes and there's a cookbook for Chef, a module for Puppet and a role for Ansible as well.
Logging
Much like Stackdriver Monitoring, Stackdriver Logging works on both Cloud Platform and Amazon Web Services. It's set up by default for App Engine, and also captures some Google Container Engine events. Installing the Logging agent on your Compute Engine VMs is simple. Additionally, there are packages available for many web frameworks to integrate Stackdriver Logging with your application.If your framework isn't supported or you need custom events, you can use the Stackdriver Logging API to send events directly to Stackdriver. The API also supports viewing entries and managing logging for your project.
I like that the Stackdriver Logging UI supports searching by time interval, response code, log level, log source and other things that I find helpful. In the past, I've had to write code to do this level of filtering. And if search capabilities of the Logging UI aren't sufficient, you can export your logs to Google BigQuery, which can quickly query, aggregate or filter several terabytes of data. You can also save your queries with BigQuery to repeat them later and to share results with others.

Error reporting
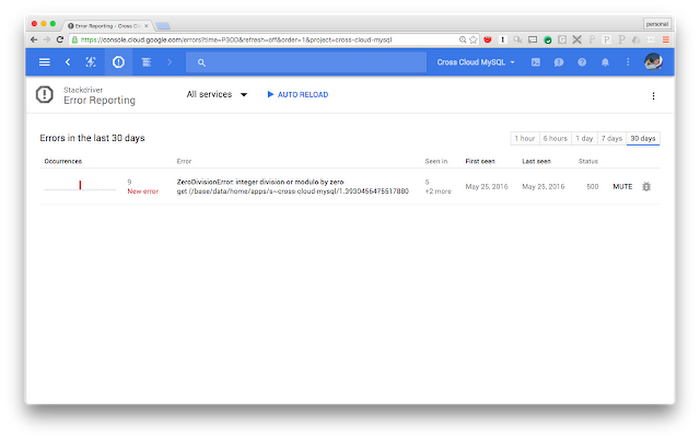
One of the problems I've often run into is the idea of a "normal error." Most applications seem to have an edge case or other error condition that causes an error, but that isn't a priority to fix. This is why I like Stackdriver Error Reporting. Stackdriver Error Reporting monitors your application errors, aggregates them, and then alerts you to new errors that arise.You can use the Error Reporting console to see how many of each error have occured, what versions of your application the error occurred in, and when it was first or last seen. Error Reporting saves a few representative stack traces from the error to help you debug your application. You can also link a specific error to a bug in your bug tracker.
Error Reporting is automatically set up for App Engine applications. It currently supports Java, Python, Javascript, PHP and Go. To use Error Reporting in other environments you can call an API from your application or you can send error events to Stackdriver Logging in a specific format. To receive alerts about new errors you can opt-in from Google Cloud Console.
Debugging
Once you've noticed an error in your application with Error Reporting or Stackdriver Logging, you may need to debug your application to prevent the error from happening again. Stackdriver Debugger can help you here. Instead of hooking up a debugger to the production website (something many of us have done and very few will recommend), Stackdriver Debugger takes a snapshot of the application state at a specified point. The snapshot shows you the call stack and variable values without the need to push instrumented code to production.To take a snapshot, all you need to do is supply a filename and line number. If you have access to the source code for your application you can upload it to Stackdriver Debugger. You can also point Debugger at a cloud repository or load the source code into the browser locally. When the source code is available you can set snapshot points in Debugger much like you set breakpoints in an IDE. This allows you to see the captured values in the context of the code.
Stackdriver Debugger is automatically enabled for all App Engine applications. Better yet, it doesn't add a large amount of latency to captured requests so your users will likely not notice a performance hit.