Stackdriver Trace + Zipkin: distributed tracing and performance analysis for everyone
Morgan McLean
Product Manager
Editor's Note: You can now use Zipkin tracers with Stackdriver Trace. Go here to get started.
Part of the promise of the Google Cloud Platform is that it gives developers access to the same tools and technologies that we use to run at Google-scale. As the evolution of our Dapper distributed tracing system, Stackdriver Trace is one of those tools, letting developers analyze application latency and quickly isolate the causes of poor performance. While it was initially focused on Google App Engine projects, Stackdriver Trace also supports applications running on virtual machines or containers via instrumentation libraries for Node.js, Java, and Go (Ruby and .Net support will be available soon), and also through an API. Trace is available at no charge for all projects, and our instrumentation libraries are all open source with permissive licenses.
Another popular distributed tracing system is Zipkin, which Twitter open-sourced in 2012. Zipkin provides a plethora of instrumentation libraries for capturing traces from applications, as well as a backend system for storing and presenting traces through a web interface. Zipkin is widely used; in addition to Twitter, Yelp and Salesforce are major contributors to the project, and organizations around the world use it to view and diagnose the performance of their distributed services.
Zipkin users have been asking for interoperability with Stackdriver Trace, so today we’re releasing a Zipkin server that allows Zipkin-compatible clients to send traces to Stackdriver Trace for analysis.
This will be useful for two groups of people: developers whose applications are written in a language or framework that Stackdriver Trace doesn’t officially support, and owners of applications that are currently instrumented with Zipkin who want access to Stackdriver Trace’s advanced analysis tools. We’re releasing this code open source on GitHub with a permissive license, as well as a container image for quick set-up.
As described above, the new Stackdriver Trace Zipkin Connector is a drop-in replacement for an existing Zipkin backend and continues to use the same Zipkin-compatible tracers. You no longer need to set up, manage or maintain a Zipkin backend. Alternatively, you can run the new collector on each service that's instrumented with Zipkin tracers.
There are currently Zipkin clients available for Java, .Net, Node.js, Python, Ruby and Go, with built-in integration to a variety of popular web frameworks.
Setup Instructions
Read the Using Stackdriver with Zipkin Collector guide to configure and collect trace data from your distributed tracer. If you're not already using a tracer client, you can find one in a list of the most popular Zipkin tracers.FAQ
Q: What does this announcement mean if I’ve been wanting to use Stackdriver Trace but it doesn’t yet support my language?If a Zipkin tracer supports your chosen language and framework, you can now use Stackdriver Trace by having the tracer library send its data to the Stackdriver Trace Zipkin Collector.
Q: What does this announcement mean if I currently use Zipkin?
You’re welcome to set up the Stackdriver Trace Zipkin server and use it in conjunction with or as a replacement for your existing Zipkin backend. In addition to displaying traces, Stackdriver Trace includes advanced analysis tools like Insights and Latency Reports that will work with trace data collected from Zipkin tracers. As Stackdriver Trace is hosted by Google, you'll not need to maintain your own backend services for trace collection and display.
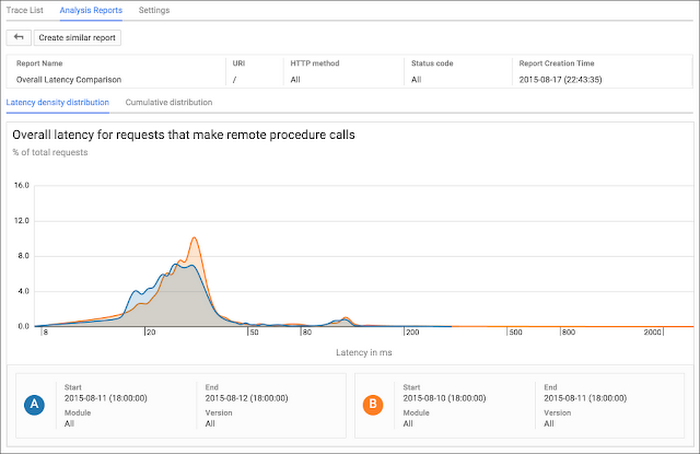
Latency reports are available to all Stackdriver Trace customers
Q: What are the limitations of using the Stackdriver Trace Zipkin Collector?
This release has two known limitations:
- Zipkin tracers must support the correct Zipkin time and duration semantics.
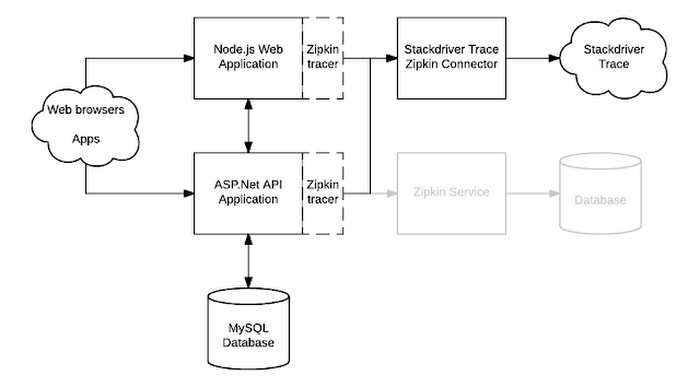
- Zipkin tracers and the Stackdriver Trace instrumentation libraries can’t append spans to the same traces, meaning that traces that are captured in one library won’t contain spans for services instrumented in the other type of library. For example:
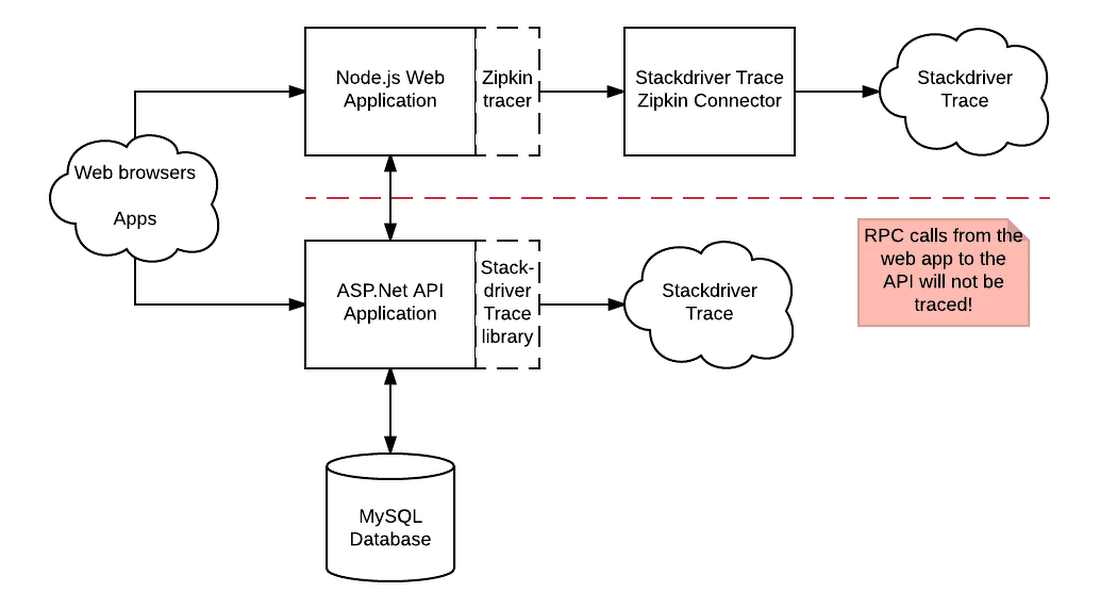
- In this example, requests made to the Node.js web application will be traced with the Zipkin library and sent to Stackdriver Trace. However, these traces do not contain spans generated within the API application or for the RPC calls that it makes to the Database. This is because Zipkin and Stackdriver Trace use different formats for propagating trace context between services.
- For this reason we recommend that projects wanting to use Stackdriver Trace either exclusively use Zipkin-compatible tracers along with the Zipkin Connector, or use instrumentation libraries that work natively with Stackdriver Trace (like the official Node.js, Java or Go libraries).
Q: Will this work as a full Zipkin server?
No, as the initial release only supports write operations. Let us know if you think that adding read operations would be useful, or submit a pull request through GitHub.
Q: How much does Stackdriver Trace cost?
You can use Zipkin with Stackdriver Trace at no cost.
Q: Can I use Stackdriver Trace to analyze my AWS, on-premises, or hybrid applications or is it strictly for services running on Google Cloud Platform?
Several projects already do this today! Stackdriver Trace will analyze all data submitted through its API, regardless of where the instrumented service is hosted, including traces and spans collected from the the Stackdriver Trace instrumentation libraries or through the Stackdriver Trace Zipkin Connector.
Wrapping up
We here on the Stackdriver team would like to send out a huge thank you to Adrian Cole of the Zipkin open source project. Adrian’s enthusiasm, technical assistance, design feedback and help with the release process have been invaluable. We hope to expand this collaboration with Zipkin and other open source projects in the future. A huge shout out is also due to the developers on the Stackdriver team who developed this feature.Like the Stackdriver Trace instrumentation libraries, the Zipkin Connector has been published on GitHub under the Apache license. Feel free to file issues there or submit pull requests for proposed changes.