Using load shedding to survive a success disaster—CRE life lessons
Dave Rensin
Director, Customer Reliability Engineering, Google Cloud
Adrian Hilton
Customer Reliability Engineer, SRE
Accelerate State of DevOps Report
Get a comprehensive view of the DevOps industry, providing actionable guidance for organizations of all sizes.
DownloadEditor’s note: Just because something is a good problem to have, doesn’t mean it’s not a problem. In this latest installment of the CRE life lessons series, we learn about techniques that the Google Site Reliability Engineering team uses to handle too much of a good thing (traffic) with grace—and how you can apply them to your own code running on Google Cloud.
In our last installment in this series, we talked about how to prevent an accidental DDoS from your own code. In this post, we’ll talk about what to do when you have the problem everybody hopes for — the success disaster.
The most painful kind of software failure is the "success disaster." This happens when your application consistently gets more traffic than you can sustainably handle. While you scramble to add capacity, your users may start to get the idea that it’s not worth the effort to use your system and eventually leave for something else.
What makes this the worst sort of failure is that nobody thinks it will happen to them while simultaneously hoping it does. It’s an entirely avoidable problem. Embrace the practice of load shedding and spare yourself the pain of this regret. Load shedding is a technique that allows your system to serve nominal capacity, regardless of how much traffic is being sent to it, in order to maintain availability. To do this, you'll need to throw away some requests and make clients retry.
Procrustean load shedding
You may recall, Poseidon’s son Procrustes had a very, um, one-size-fits-all approach to accommodating his overnight guests. In its simplest form, load shedding can be a bit like that too: observe some easily obtained local measure like CPU load, memory utilization or request queue length, and when this load number crosses a predetermined “safe” level as established by load testing, drop a fraction of incoming traffic to bring the load back to safe levels. For example, the system may drop the first n of each 10 requests where n starts at 1, ramps up as system load stays high, and drops gradually as the load returns to safe levels.For example, here’s a Python method that processes a new request while keeping the load under a hard limit of 45 units and pushing down towards a soft limit of 25 units:
When you feed a varying load into this system, you get the behavior seen below:
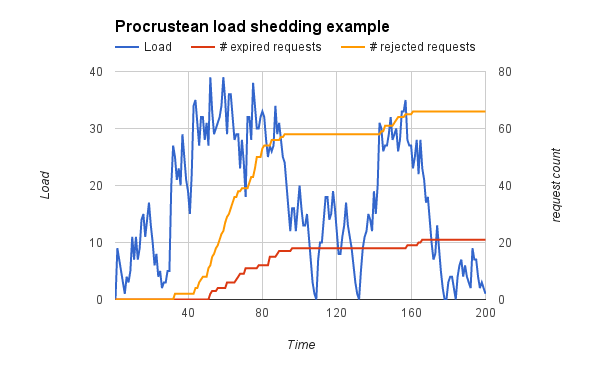
In the system modeled requests expire after a fixed time and are of varying cost. At a normal request rate (0-2 requests/sec) the system is running comfortably within limits. When requests double at t=30, the load shedding kicks in; we start to see a rise in rejected and expired requests but the load is kept under the hard limit. Rejected requests are more common than expired ones, which is what we want as expired requests consume system resources for no utility. Once the request rate returns to normal at t=90, new rejected and expired requests stop. Between t=120 and t=150 there's a 50% rise in requests, which reactivates load shedding but at a lower rate.
This kind of load shedding is simple to implement and is definitely better than having no load shedding at all, but it also has at least one very serious drawback: it assumes that all types of requests and clients are equal. In our experience, this is seldom true. If 95% of your online store’s requests are people paging through your catalog, and 5% are actual purchase requests, wouldn’t you want to prioritize the latter? A Procrustean approach to load shedding won’t help you with this.
Fortunately there are alternatives.
Ranking requests for criticality and cost
Before you can safely throw away less valuable work (i.e., drop requests, refuse connections, etc.) you first have to rank the relative importance of each request. That means figuring out what a request costs.Every request has two costs:
- The cost to perform the work (the direct cost)
- The cost to not perform the work (the opportunity cost)
Opportunity cost, on the other hand, is a little trickier to calculate. How do you measure the cost of not doing something? It’s tempting to try to express it in terms of dollars but that’s usually an oversimplification. Dollars of revenue are not the same as dollars of profit. One might be vitally more important to your business than another. With that in mind, here are two rules to remember when thinking about this:
- Denominate your costs in terms of your scarcest resource. If CPU is the scarcest thing in your system then use that to express all of your costs. If it’s revenue or profit then use that. At Google, for example, we sometimes use engineering hours as a measure of cost because we perceive engineering time as more scarce than dollars.
- Get everyone to agree on the units before you start ranking request types. Different parts of your business will have different views of the costs of dropping traffic. The ads team might value the dollars in lost revenue for not serving a piece of content while your marketing team might value the total number of users that can simultaneously access your application. The UX team, on the other hand, might think that latency is the most important thing since laggy UIs make users grumpy. The point is that this all gets settled by deciding on the denominating units first!
Of course, even this has its nuances. For example, some load shedding systems are designed to minimize the aggregate opportunity cost in the system while others consider how the opportunity costs and direct costs relate to each other. (Known as weighted or scaled costs.)
It’s almost never possible to know either the direct or opportunity cost of a specific query at runtime. Even if you could know, it’s likely that the computational overhead of calculating it in-line for every request would seriously reduce your serving capacity. Instead, you should establish a few criticality buckets or classes for your known request types. This way you can more easily classify each request into one of the buckets and use that to stack-rank their priorities. (Those of you with networking backgrounds will recognize this as a key component of Quality of Service (QoS) systems.)
Setting criticality
For load shedding to work best, your system should determine the criticality bucket of a request as early as possible, and as cheaply as possible, based on your criteria. Some common examples of how to determine criticality include:
- An explicit field in the request specifying the bucket.
- Bucketing by the hostname, which lets you "black-hole" low-priority traffic in overload situations by using DNS to point to a sacrificial server. This is a big hammer, but occasionally life-saving because it can stop requests from reaching your overloaded service in the first place.
- The URL path, which is fairly cheap to check though does require some extra processing by your front-end service.
- User ID, and whether it belongs to a specific group, e.g.,"paying customers" (highest), "logged in users" (medium-high), "logged-out users" (medium-low), "known robot accounts" (lowest). This allows the most precise bucketing, but is more expensive to check for each request.
We’ve had several painful experiences where a rogue client was using the same hostname as many good clients, making it impossible to block the rogue without affecting the good clients as well. Now, in situations where a public HTTP-based infrastructure service serves many different kinds of clients, every type of client accesses the service through its own hostname. This allows us to isolate all traffic from a badly-behaved client and route it to more distant servers with spare capacity. While this may increase latency for these bad clients, it spares other client types. Alternatively we can designate a subset of servers to handle the bad client traffic as best as they can, accepting that they'll likely become overloaded, and keep traffic from other clients away from those hosts. There’s also the last-ditch option of simply black-holing the bad traffic.
Criticality changes over time
Opportunity costs seldom follow a straight line, and what’s critical now, might not be later. Over time, a request might move from one criticality bucket to another. Take for example, loading your front page.At first, the request to load your front page is very valuable because it’s serving important content (perhaps ads) to your user. After a certain amount of waiting, say 2 seconds, the user will probably abandon the slow page and go someplace else. That means from 0.0 second until 1.9 seconds the request to load your front page might be in your highest criticality bucket. Once it hits 2.0 seconds, however, you might as well drop it to the lowest bucket (or cancel it altogether), because the user probably isn’t there anymore.
For this reason, a great source of load that you can shed cheaply is requests that are exceeding their response deadlines, as established by user interface data and design. The better tuned your deadlines, the cheaper this will be.
Soft quotas vs. hard quotas
Suppose your system has a total serving capacity of 1,000,000 QPS and you average 10,000 simultaneous users at peak. In order to protect yourself from particularly demanding users you decide to cap each client at 100 QPS. This cap is called a quota.The problem, of course, with giving each client a hard quota of 100 QPS is that when you have fewer than 10,000 clients hitting your backends, you have idle capacity. Wasted capacity can never be recovered (at least without the aid of a time machine) so you should avoid that at all costs. An important principle we follow inside Google is work conservation — which can be stated as clients who have exceeded their quotas should not be throttled if the system has remaining capacity.
In our example the 100 QPS quota is a soft quota because it shouldn’t necessarily be enforced if the system can tolerate the extra load. A hard quota, on the other hand, is a limitation that cannot ever be exceeded under any circumstances. Hard quotas exist to protect your infrastructure while soft quotas exist to help you manage finite resources “equitably” — however that’s defined in your business.
This brings us to another important consideration: fairness. When the system runs out of capacity then the clients who are most over their quotas should be the first to be throttled. If user X is sending 150 QPS to the system and user Y is sending 500 QPS, it might be unfair to squash user X until user Y has had 350 QPS load-shed.
Optimistic and pessimistic throttling
Having decided which traffic to throttle, you still need to decide how to throttle. Your two basic choices are optimistic and pessimistic throttling.Optimistic throttling just means that you don’t start dropping traffic until you reach global capacity. When this happens, the load shedding system starts working its way through requests, beginning with the least important items and working back up the stack until things are healthy again. The advantage to this approach is that it’s pretty easy to implement and relatively computationally “cheap” because you’re not reacting until you get close to your global limit.
The downside of optimistic throttling, however, is that you'll spike over your global maximum while you start shedding load. Most users will only experience this momentary overload in the form of slightly higher latency, and for this reason, this is our recommended approach for a majority of systems.
If you do choose to go down the optimistic throttling path, it’s super important to thoroughly test your logic. With this approach, there’s a risk that your active load shedding may break due to a coding error in one of your binary releases, and you may not notice it for several weeks until you hit a peak that triggers load shedding and your servers start to segfault. Not that this has ever happened to us . . . ;-)
Pessimistic throttling, on the other hand, assumes that you may not exceed your global maximum under any circumstance — not even for a very short period of time. This is a more computationally expensive approach because the load management system has to continually compute (and recompute) quotas and other limits and transmit them throughout your system. This almost always means that you never quite serve up to your global capacity. And even when you do, the additional computational load eats into capacity that would otherwise be serving capacity. For these reasons, pessimistic throttling is more difficult and costlier to implement and maintain.
Throttling as a signal
If you're the owner of a system that has started to throttle some of its traffic, what does that tell you?The naive interpretation is that you have a problem that you need to fix, and the simplest approach is to add more capacity in the system. For example, you could turn up more servers, or add resources to the ones you already have. However, if you’re spending 20% more to keep 20% more servers up and running, but the extra capacity is only used for a few minutes at peak every day, this isn’t a good use of resources.
Instead, look at the effects of throttling in terms of user experience and revenue. Are real users seeing errors or service degradation as a result? If so, what fraction of active users are affected? How many revenue-related requests are being throttled? How much is this costing you, compared to the cost of providing extra compute resource to serve those requests?
In many cases, if the system is only throttling non-interactive retryable requests, then your system is probably working as intended. As long as the throttling period is not prolonged and the retries are completing within your processing SLO there’s no real reason to spend more money to serve them more promptly. That said, if your service is throttling traffic for 12 hours every day, it may be time to do something about its capacity.
Analyzing the impact of throttling should be relatively easy to perform because you’re already classifying your requests into buckets, while monitoring tools can show you what fraction of each bucket’s requests was throttled.
Case study
Google once ran a service with many millions of mobile clients that cached users’ state on their mobile devices about images that were incrementally uploaded (in the background) to a backend storage service. The service was designed to handle peak global traffic, plus an additional margin, with the assumption that two serving locations could be unavailable at any one time. The service also handled a significant amount of interactive (user-facing) traffic.We identified this service as a candidate for load shedding, and implemented it by marking requests with a new "request priority" field, with values ranging from "critical user-facing" to "non-critical background" (background uploads). The service was set to automatically shed requests once it reached its predetermined maximum capacity, starting with the lowest priority and working its way up.
Two days after the load shedding code made it to production, a new app release was pushed to the clients that had the unfortunate side effect of resetting the record of which data had already been uploaded. This bug made all the clients try to connect to our service at once to re-upload all their data. You can see the upload failure rate in the following graph:
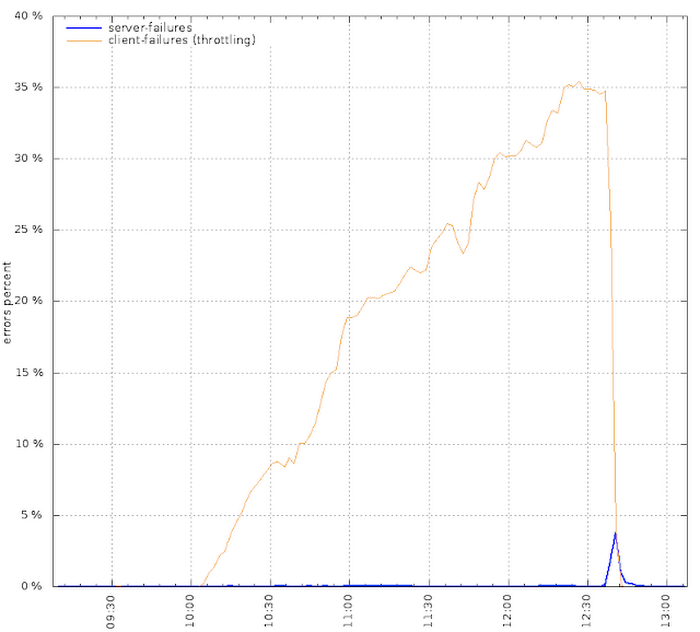
This is not a graph you want to see if you’re the SRE on call. But the system continued to serve traffic correctly. Load shedding saved it from becoming overloaded by dropping nearly half of all background upload requests, while the remaining clients patiently backed off and retried again later. After a couple of hours, we turned up enough additional capacity to handle the load, the clients uploaded their data, and things went back to normal. (The short spike in server errors is an artefact of the way we disabled the throttling once the new capacity was in place.) In short, load shedding provided defense-in-depth against an irreversible coding bug.
Wrapping up
We all want to build systems whose popularity exceeds our wildest dreams. In thinking about those cases, however, we too often dismiss them by saying “that’s a problem I’d like to have!” In our experience, these are only problems you want to have until you have them. Then they’re just problems — and painful ones at that.Reliability is your most important feature and you want your application to be insanely popular. Load shedding is a cheap way to design with that success in mind. Build it in early and you’ll spare yourself the agony of pondering what might have been.