Introducing Stackdriver APM and Stackdriver Profiler
Morgan McLean
Product Manager
Distributed tracing, debugging, and profiling for your performance-sensitive applications
Like all developers that care about their users, you’re probably obsessed with how your applications perform and how you can make them faster and more reliable. Monitoring and logging software like Stackdriver Monitoring and Logging provide a first line of defense, alerting you to potential infrastructure or security problems, but what if the performance problem lies deeper than that, in your code?
Here at Google, we’re developers too, and we know that tracking down performance problems in your code can be hard—particularly if the application is live. Today we’re announcing new products that offer the same Application Performance Management (APM) capabilities that we use internally to monitor and tune the performance of our own applications. These tools are powerful, can be used on applications running anywhere, and are priced so that virtually any developer can make use of them.
The foundation of our APM tooling is two existing products, Stackdriver Trace and Debugger, which give you the power to analyze and debug applications while they're running in production, without impacting user experience in any way.
On top of that, we’re introducing Stackdriver Profiler to our APM toolkit, which lets you profile and explore how your code actually executes in production, to optimize performance and reduce cost of computation.
We’re also announcing integrations between Stackdriver Debugger and GitHub Enterprise and GitLab, adding to our existing code mirroring functionality for GitHub, Bitbucket, Google Cloud Repositories, as well as locally-stored source code.
All of these tools work with code and applications that run on any cloud or even on-premises infrastructure, so no matter where you run your application, you now have a consistent, accessible APM toolkit to monitor and manage the performance of your applications.
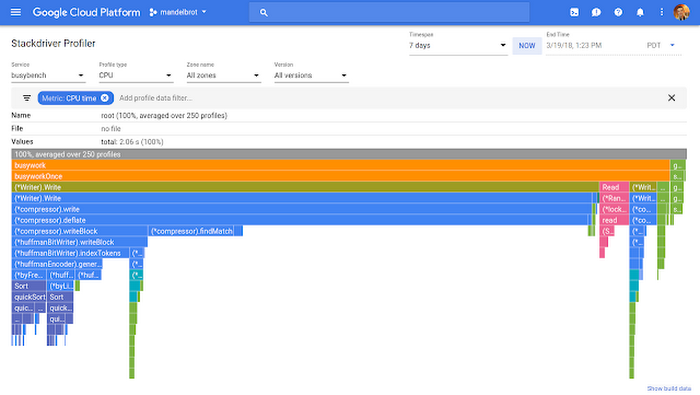
Introducing Stackdriver Profiler
Production profiling is immensely powerful, and lets you gauge the impact of any function or line of code on your application’s overall performance. If you don’t analyze code execution in production, unexpectedly resource-intensive functions increase the latency and cost of web services every day, without anyone knowing or being able to do anything about it.At Google, we continuously profile our applications to identify inefficiently written code, and these tools are used every day across the company. Outside of Google, however, these techniques haven’t been widely adopted by service developers, for a few reasons:
- While profiling client applications locally can yield useful results, inspecting service execution in development or test environments does not.
- Profiling production service performance through traditional methods can be difficult and risks causing slowdowns for customers.
- Existing production profiling tools can be expensive, and there’s always the option of simply scaling up a poorly performing service with more computing power (for a price).
- It analyzes code execution across all environments.
- It runs continually and uses statistical methods to minimize impact on targeted codebases.
- It makes it more cost-effective to identify and remediate your performance problems rather than scaling up and increasing your monthly bill.
Early access customers have used Stackdriver Profiler to improve performance and reduce their costs.
We used Stackdriver Profiler as part of an effort to improve the scalability of our services. It helped us to pinpoint areas we can optimize and reduce CPU time, which means a lot to us at our scale.
Nicolas Fonrose, CEO, Teevity
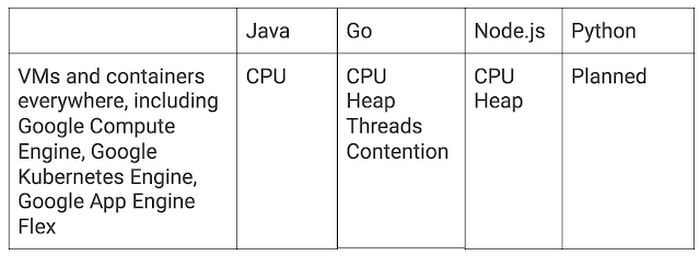
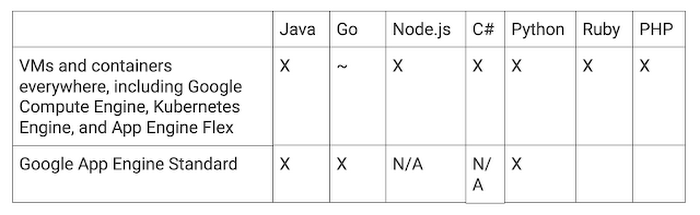
Stackdriver Profiler is now in public beta, available for everyone. It supports:
Unearth tricky code problems with Stackdriver Debugger
Stackdriver Debugger provides a familiar breakpoint-style debugging process for production applications, with no negative customer impact.
Additionally, Stackdriver Debugger’s logpoints feature allows you to add log statements to production apps, instantly, without having to redeploy them.

Debugger simplifies root-cause analysis for hard-to-find production code issues. Without Debugger, finding these kinds of problems usually requires manually adding new log statements to application code, redeploying any affected services, analyzing logs to determine what is actually going wrong, and finally, either discovering and fixing the issue or adding additional log statements and starting the cycle all over again. Debugger reduces this iteration cycle to zero.
Stackdriver Debugger is generally available and supports the following languages and platforms:
Reduce latency with Stackdriver Trace
Stackdriver Trace allows you to analyze how customer requests propagate through your application, and is immensely useful for reducing latency and performing root cause analysis. Trace continuously samples requests, automatically captures their propagation and latency, presents the results for display, and finds any latency-related trends. You can also add custom metadata to your traces for deeper analysis.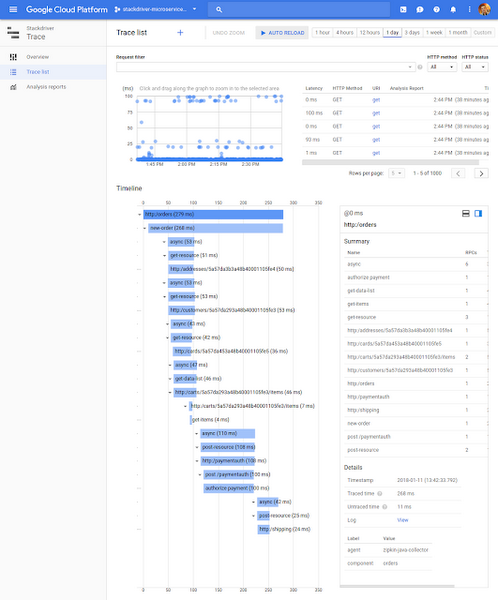
Trace is based off of Google’s own Dapper, which pioneered the concept of distributed tracing and which we still used every day to make our services faster and more reliable.
We’re also adding multi-project support to Trace in the coming weeks, a long-requested feature that will let you view complete traces across multiple GCP projects at the same time. Expect to hear more about this very soon.
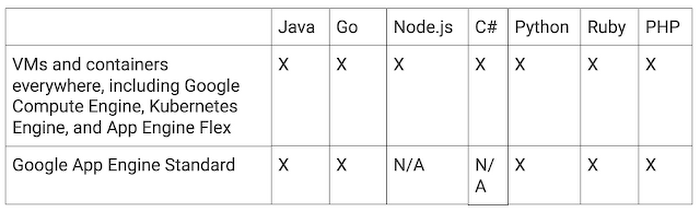
Stackdriver Trace is generally available and offers the following platform and language support:
Get started today with Stackdriver APM
Whether your application is just getting off the ground, or live and in production, using APM tools to monitor and tune its performance can be a game changer. To get started with Stackdriver APM, simply link the appropriate instrumentation library for each tool to your app and start gathering telemetry for analysis. Stackdriver Debugger is currently free, as is the beta of Stackdriver Profiler. Stackdriver Trace includes a large monthly quota of free trace submissions.To learn more, see the Stackdriver Profiler, Debugger and Trace documentation