Understand your spending at a glance with Google Cloud Billing reports beta
Stephen Elliott
Product Manager, Google
Whether you’re a developer working on a new project, an engineering manager checking your budget or a billing administrator keeping tabs on your monthly spending, you're probably asking yourself questions about your GCP bill such as:
- Which project cost the most last month?
- What’s the trend for my GCP costs?
- Which GCP product costs the most?
With billing reports you can see data for all the projects linked to a billing account. You can adjust your views to uncover specific trends, including:
- Costs grouped by project, product or SKU
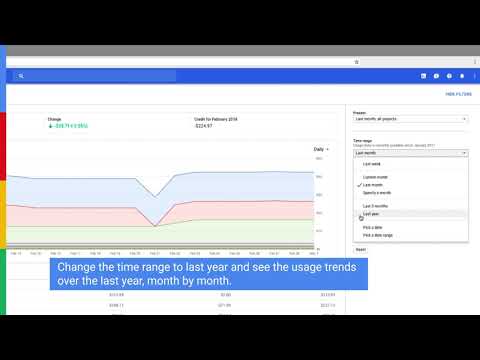
- Different time aggregation including daily and monthly views. You can even view hourly if you select a time range of one week or less.
- Costs with and without the application of service credits
Billing reports will be available to all accounts in the coming weeks. Get started by navigating to your account’s billing page in the GCP console and opening the reports tab in the left-hand navigation bar.
You can learn more in the billing reports documentation. If you're interested in creating more visualizations of your billing data you can do so by exporting to BigQuery and visualizing your billing data with Data Studio.